Once your number of connected devices grows to a certain size, it becomes difficult to keep track of them all manually. At this point you’re going to want to turn to software to do this job for you. Network monitoring software fills this need nicely. The old stable Nagios used to be my go to for this. However, I switched to checkmk in the last couple of years and have found it quite superior. I’ve recently been doing some maintenance and upgrades to my monitoring setup, so now was a good time to write it up.
Checkmk is an Open Source infrastructure and application monitoring tool. It will keep track various attributes of your networked devices and alert you if they fall outside of pre-programmed thresholds. At its core it wraps Nagios, but provides a nicer UI and GUI configuration tool. checkmk also supports autodiscovery of services and checks to be performed on each system. This means you can spin up a monitoring system with great coverage in less than half the time you would spend fiddling around with a Nagios configuration.
Monitoring vs. Metrics
I’m going to take a little time to discuss the modern trend towards “metrics” based monitoring and how it relates to more traditional monitoring approaches. Modern metrics based systems such as Prometheus and Influxdb collect a series of aggregated data points about a running system. Typically these are written to a time series database (Influxdb actually is purely a time series database and requires external data collection tools). This data would then be used to feed some graphing/dashboarding tool, such as Grafana and also to generate alerts.
This is a different approach to traditional monitoring. To my mind metrics gathering is more passive. The system is only asking what the other systems (or typically only the applications on those systems) know about themselves. It is not actually probing the network to check that things are working. Monitoring systems not only collect data from systems, but actually probe the network to create data, for example whether a given service is responding or not.
The metrics gathering approach works well if all you care about are the applications. Obviously the application knows everything about itself, so why not ask it? It’s particularly popular in cloud environments where someone else is caring about the underlying infrastructure. Anywhere you care about physical infrastructure you’d probably be better off with a monitoring system first. Of course, this doesn’t preclude adding a metrics system later!
I think its important not to get these tools mixed up, they serve different purposes, even if there is some overlap.
Let’s Start Monitoring
I’ve had checkmk installed inside an LXD container for some time. In that time it’s been running pretty much flawlessly and alerting me to issues with my network as they come up. I recently decided it was time for an update, since I was still running 1.4.x and 1.5 had been out for a while. In the process I thought I’d move it into Docker, as I’ve been moving everything else. However, I ran into some issues with that.
I had several issues moving my configuration to the new server and getting it to run in the Docker container. Most of these could have been solved if I’d migrated the configuration to the new version (described below) before moving it. I did hit one show stopper issue though. This came about because my Docker data volumes are stored on NFS. Basically it looks like NFS doesn’t support file locking very well. This causes checkmk to throw “Bad file descriptor” errors all over the place.

In the end I decided to stick with my LXD container for this system. Eventually this will be migrated to an LXC container when I switch the host server over to Proxmox. The Docker setup is not actually recommended for a full monitoring install anyway, so I don’t feel too bad about this.
This is all a long winded way of saying, go and follow the Linux installation instructions if you are installing checkmk from scratch!
Upgrading My Configuration
Since I already had an existing system I just updated it by installing the new version. In the process checkmk 1.6 was released (good timing!), so I actually did this twice. To do the update I basically just downloaded the latest .deb file and installed it with dpkg -i.
It should be noted that this won’t overwrite your current install. There is a good reason for this, since checkmk has a configuration migration step which must be performed. This can be done using the omd tool. The steps to do so look like this:
$ sudo omd sites # list the monitoring instances we have available
SITE             VERSION          COMMENTS
mysitename       1.5.0p30.cre     default version
$ sudo omd stop mysitename # stop the instance in question
$ sudo omd update mysitename
# at this point omd will update the config, it will ask you
# questions along the way in a curses window, just follow the
# prompts
$ sudo omd start mysitename # start the instance back up
Assuming that all went OK, you’re good to start actually monitoring other systems. We’ll cover the things I monitor in the next few sections.
Monitoring Standard Linux Systems
This is the easy one and pretty much standard fare for any monitoring system. Just install the checkmk agent for your distribution by following the official instructions and off you go. When you add a new host via WATO (the configuration GUI) checkmk will auto-discover as many services as it can for you. There are also a whole load of plugins that can be deployed to monitor other services.
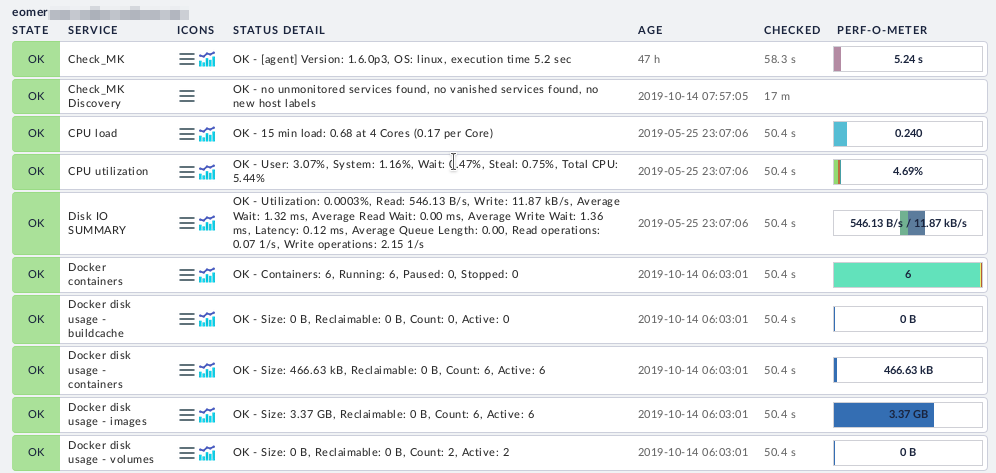
In my system, Linux machines are the majority of the hosts. This includes physical host machines, VMs, LXC/LXD containers and Raspberry Pis (since these are just Debian machines really). The only thing I haven’t had much luck with are my Libreelec machines. This seems to be because Libreelec doesn’t include a shell capable of running the agent script. I’ve been wondering if running the agent in a sufficiently privileged Docker container would work. However for now I’m just monitoring them externally (see “Monitoring Other Devices” below).
Monitoring pfSense
Since pfSense is really just FreeBSD underneath the checkmk BSD agent works fine with it. pfSense also supports SNMP out of the box. Therefore you can get more monitoring coverage by using an Agent+SNMP approach. There is a great tutorial over at Open School Solutions, which is what I followed to set all that up.
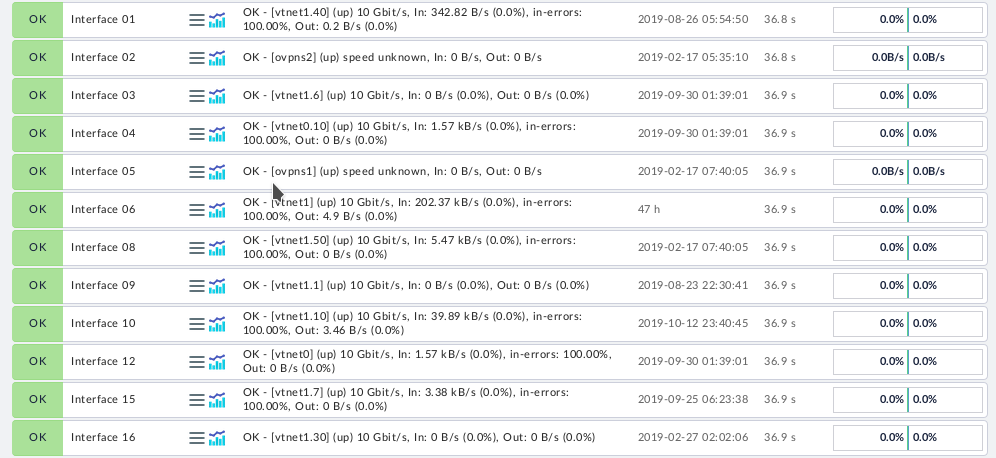
Monitoring OpenWRT Devices
OpenWRT devices can be monitored just like Linux machines. However you will need to install the OpenWRT specific agent from the agents page of your checkmk install. The agent can be run via either xinetd or SSH just as on a standard Linux machine.
OpenWRT devices will also return some extra information over SNMP if mini_snsmpd is installed on them. This makes the same Agent+SNMP approach adopted for pfSense desirable.
Monitoring Docker Containers
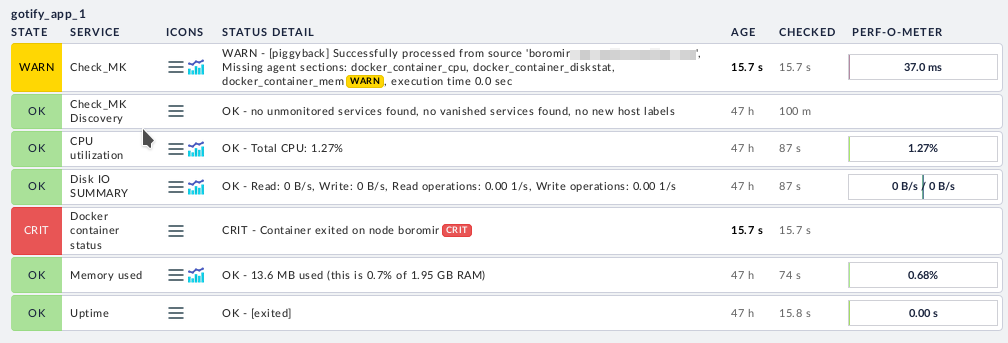
This one is new to me since I’ve just set it up after updating to the new version. The basic idea here is that you set up monitoring on the Docker host as you would a standard Linux machine. However, you also install the mk_docker.py plugin. This will do two things. Firstly it will expose a load of Docker checks on the host the next time you run service discovery. These by themselves are pretty useful. Secondly it will allow you to add each Docker container on the host as a host in it’s own right. The check data for the Docker container host is piggybacked from the agent connection to its Docker host.
At first I thought this was going to be pretty unwieldy, since you have to manually add a host entry for each Docker container. However, checkmk provides us with some tools to make this easier, which I’ll cover below.
Before you finish the setup on the Docker host, I’d recommend that you set the container_id variable in the /etc/checkmk/docker.cfg config file to name. This will allow you to add your container hosts to checkmk by name rather than by hex ID, which is much more human readable. It also avoids the situation where the hex ID changes if the container is destroyed and re-created. This obviously happens during an update of the container.
Adding Docker Container Hosts Quickly
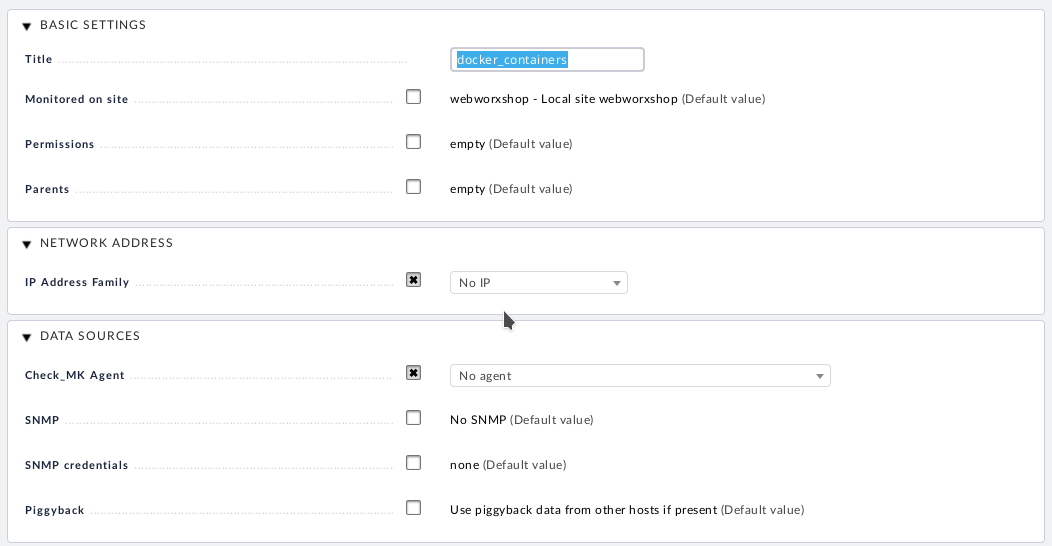
The next thing to do is to create a directory in WATO. Adding a host to a directory automatically populates the host with the configuration template used when the directory was created. This makes it super quick to just run through adding hosts with the same configuration such as our Docker containers.
The third thing to do is to create a new Host Group for your Docker containers. In this way you can easily see separate listings of your containers and other hosts on the monitoring dashboards.
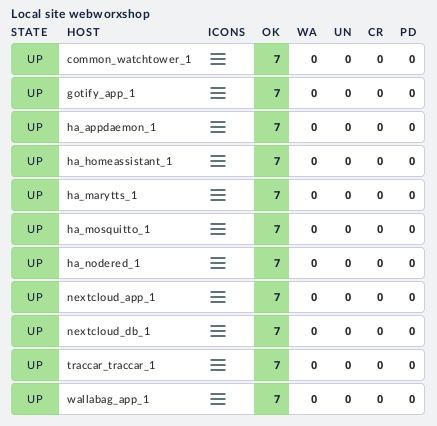
With these things in place I’m finding the Docker container monitoring pretty useful in my fairly static environment. Due to the manual steps involved it’s really not going to work in a highly dynamic environment, but it works for my needs.
Monitoring Windows Machines
Obviously checkmk also has an agent for Windows, so you can monitor those machines too. If you have any. I don’t, so I can’t comment on how well it works!
Monitoring Other Devices
For monitoring other devices that don’t support any of the available agents, you’re pretty much limited to external probing. With this you can get basic information on whether the device is up or down (via ping) and can check the availability of services on any open ports via manual checks.
Manual checks are in fact useful against any of the systems listed above as an external verification that a service is responding. As a minimum I typically implement an SSH check as well as HTTP checks on any open web services.
I have this approach deployed against several devices on my network including the two Libreelec devices mentioned above, my HDHomeRun and various IoT devices. It works pretty well – especially as the usual problem with these devices is that someone has unplugged them!
Conclusion
I hope this has given you a glimpse into my monitoring setup. It’s impossible to describe every part of it in full detail so I’ve opted for presenting only an overview here. Even after nearly two years I’m still adding and changing stuff on this system, so I may write up some of the more interesting details in future.
I’m really happy with my choice of checkmk to drive my monitoring system. It’s a nice blend of the reliability and stability of Nagios, with a layer of UI which makes it much easier to get a fully featured system. The recent upgrades have provided some useful features and it’s great to see it under such active development!
Next Steps
I still have some corners of my network where my monitoring setup doesn’t cover. Mainly just through lack of time to get it all set up. I’ll be looking to Ansible to help with this soon.
I’d also like to add some kind of metrics gathering system, probably Influxdb. This will be for Home Assistant data and metrics from my Traefik proxies (as well as anything else I can feed to it). I’d also like to round out the trifecta of observation systems with a log storage/aggregation system. I just wish there was something more lightweight than an ELK stack!
If you have any comments or improvements to my setup, as always, let me know in the feedback channels. I’m also interested in how others are handling this, so get in touch and let me know.
Leave a Reply